MI Start Map
A DASHBOARD to understand COVID-19 IN MICHIGAN
Launch stats: 60k + unique users on day one with visitors from 24 countries
Skills
Wireframing,
Cross-functional collaboration
Team
2 Web Developers,
1 Project Manager,
3 UX Designers,
3 UX Researchers
What is MI Safe Start Map?
MI Safe Start Map is a dashboard designed to monitor the status of COVID-19 indicators across the state of Michigan. The dashboard tracks and displays the current risk level of Michigan regions and counties due to COVID-19. The dashboard aims to achieve two goals:
1. Improve decision making at regional/county levels
To assist public health officials in making state, regional, and county-level decisions related to reopening businesses and communities in light of COVID-19.
2. Reduce misinformation amongst the general public
To provide the general public with the data that may affect specific public health decisions, and help them understand the dynamic nature of the pandemic.
The problem
How do I know what I'm looking at?

Pre-launch user testing showed us that 30% of participants struggled with identifiying the first steps to take on the dashboard
Approach

Research
Usability Evaluation
We worked closely with our research team to conduct a series of remote usability evaluations to determine the cause of our challenge and isolate opportunities for design changes
"What is the purpose of the map?"
"I'm not sure what to do here..."
Opportunities & Hypotheses
Form ≠ Function
Filters were hidden and map interactivity wasn’t immediately obvious to new users
Unclear Grouping
Relationships between elements on the page wasn’t being communicated clearly
Page Hierarchy
The order in which information is presented to does not provide enough guidance to users trying to engage with the data
Explorations
Exploration
With our opportunities and hypotheses in mind, we started exploring different configurations of the home page. Some of our ideas maintained the original structure of the website with smaller changes, whereas others explored a complete redesign
At this point, we brought in engineering before making any concrete decisions because of our tight timeline. After evaluating the feasibility of our ideas, we decided to maintain the original structure of the site.
Narrowing Focus
Even though we were maintaining elements of the original website, our design approach was to create a clearer distinction between the interactive and non-interactive areas on the webpage. Further, we also proposed that the interactive filter panel have a standardized hierarchy of content, both for consistency and scalability.

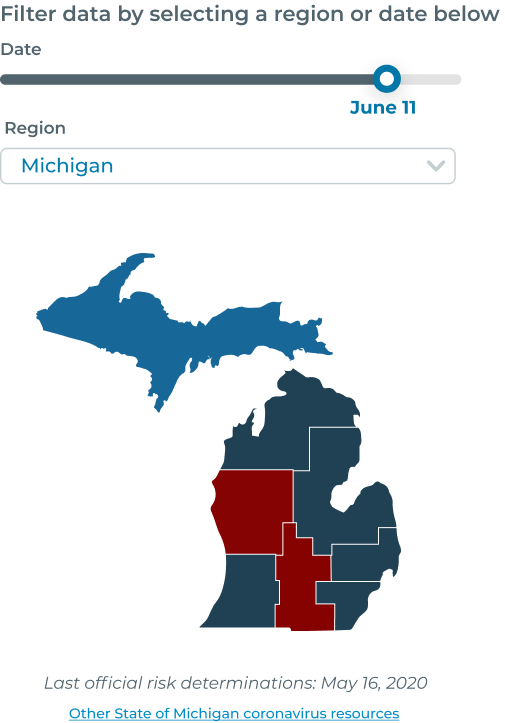
We explored multiple directions for the standardized filter card and arrived at these two. The version with a date picker felt more practical for dashboard, but our hypothesis was that using a slider instead, could add a touch of delight and additional interactivity with the map itself.
Testing our hypotheses
As we began to evaluate the efficiency our designs, we set up our with 3 key questions in mind:
1. Does the structure of the filter card communicate the actions users can take?
2. Does the distinction between filter and data areas make the relationship between the two evident?
3. Are we effectively communicating the state of the system?
Testing outcome & final designs
Much to our delight (and theirs) our users overwhelmingly preferred the version with the slider. By introducing just a little bit of fun and engaging our users' curiosity, we were able to successfully elicit a first action. Almost 20% more users engaged with the slider bar as their first click compared to the traditional date picker.
Launch day! 🎉
With launch date coming up, we were excited to present the new and improved dashboard to users!
Within the first week of launch, we tracked:
15%
Decrease in bounce rate
Learnings & Takeaways
Design to inspire curiousity
Delight and curiosity drive more than I had thought, even on a seemingly boring (or scary) dashboard
Learn to collaborate and collaborate to learn
Our team consisted of public health specialists, data scientists, researchers, PM's, and other designers. Work across so many functions taught me to be a better designer, communicator and team player
Reflect every once in a while
Take the time out of busy sprints to reflect and do a retro. Moving quickly has its advantages, but taking the time to evaluate as your build will never hurt
Keep going!
Up next: Pickflix
A movie recommendation systems for groups that I worked on as a side project with a group of developers and a PM.
GO TO PROJECT